 Walk Flower


Walking Stats Explained: Steps per Hour, Streaks, Speed and Steadiness
What your step statistics actually mean: daily goals, goal days vs streaks, best hours, hourly rhythm, the 28-day trend, and Apple Health's walking speed, step length, steadiness and asymmetry.
Your walking stats are easiest to read in two layers. The first is how much and how often you walk: daily steps, goal days, streaks, records and a trend. The second is how you walk, which an iPhone measures on its own: walking speed, step length, steadiness, asymmetry and double support time. The first layer tells you whether the habit is holding; the second only matters as a change against your own past.
Step counters have started showing a lot more than a daily number. Below is what each statistic means, what a good sign looks like, and which ones are worth ignoring. The examples come from Walk Flower’s Profile tab, which shows all of these, but the definitions apply to Apple Health, Pedometer++, StepsApp or any pedometer that keeps hourly history.
We make Walk Flower. The research cited here is from Apple and from published step-count studies, and it applies whichever app you use.
Walking stats at a glance
| Stat | What it tells you | A good sign |
|---|---|---|
| Daily steps and average | How much you walk on a typical day | An average near your goal, not one heroic day |
| Goal days | The share of days you reached your goal | Rising month on month |
| Streak | Goal days in a row, now and your best | Any; a broken streak isn’t a failed month |
| Best day, week and hour | Your ceiling | Context: a record is rare by definition |
| Active hours, steps per hour | How spread out your walking is | More hours with 250+ steps |
| Hourly rhythm | When in the day and week you walk | A gap you can fill |
| 28-day trend | Whether this month beats the last | Flat or up; dips after a record are normal |
| Distance and floors | Steps as kilometres and climbs | Fun to collect; no target needed |
| Speed, step length, steadiness, asymmetry | How you walk, from the phone’s motion sensors | Stable against your own history |
Daily steps, the average and your goal
The daily total is the one number every pedometer agrees on, and the one that matters least on its own. A single day says little. The average per day over a week or a month says a lot, and the gap between your average and your best day shows how much of your walking depends on good days.
The right goal depends on who you are. The largest pooled study to date, a 2022 meta-analysis of 15 cohorts in The Lancet Public Health, found that the risk of dying from any cause kept falling with more daily steps until about 8,000 to 10,000 a day for adults under 60, and about 6,000 to 8,000 a day for adults 60 and older. Past those points the curve flattens. That is why the famous 10,000 is a fine goal but not a magic one, and why 5,000 a day is already a long way from 3,000.
In Walk Flower the goal comes with the season you pick each week: 5,000, 8,000 or 10,000 steps a day. Every statistic that mentions a goal, from goal days to the goal map, uses the goal that was in force that day, so switching seasons never rewrites last month.
Goal days: the kinder cousin of the streak
Goal days is the share of days in a period on which you reached your goal: 22 of 31 this month, say, or 71%. It is the single most useful habit statistic, because it treats every day the same. Missing one Tuesday takes one day off the score. It does not zero anything.
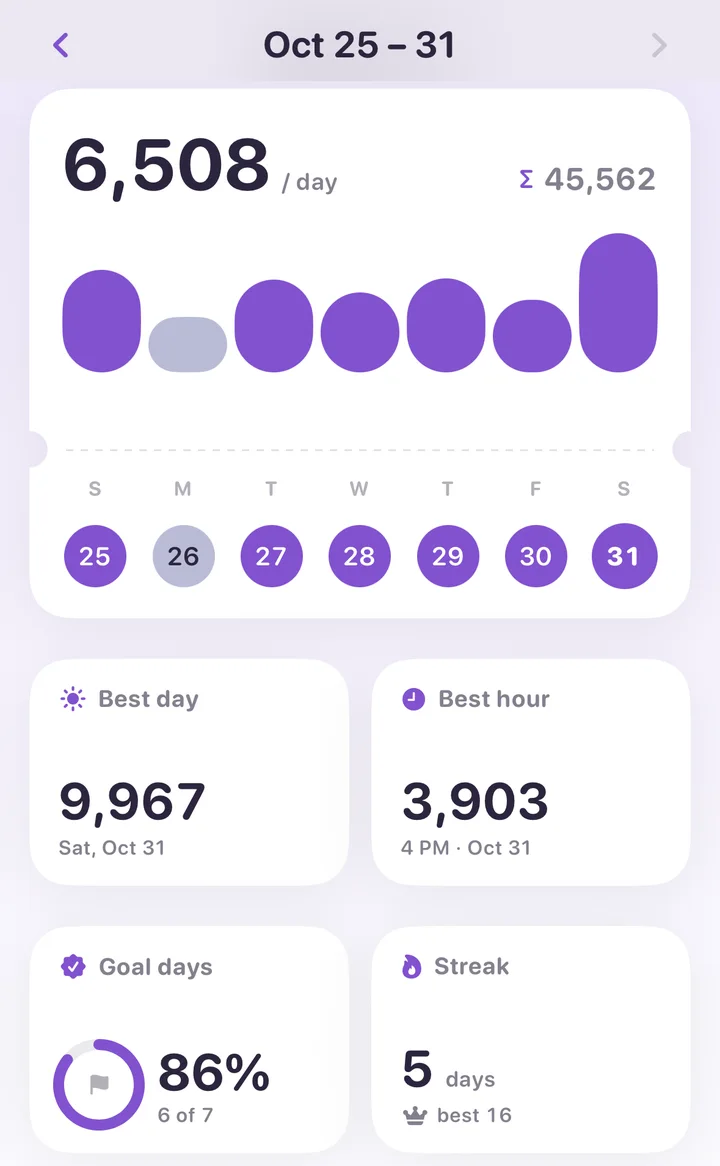
Watch the rate over months rather than days. Going from 40% to 60% of days is a real change in your life even if your average steps barely moved, because it means walking stopped depending on the weekend.
Streaks: good for momentum, bad for judgment
A streak counts goal days in a row. Apps keep two: the current one and your best ever. Streaks are motivating in the moment and bad at describing a month: a 30-day month with one sick day in the middle shows as a streak of 14, which is a worse number than the month deserves.
Read them together. Goal days tells you how the habit is doing; the streak tells you how long since the last miss. If your best streak is 9 and your goal-day rate is 80%, you miss about one day in five, roughly on schedule, and the streak will never get long. That is fine. The rate is the one to improve.
Best day, best week, best hour
Records are the fun ones. A best day is usually a trip or a hike; a best week is a holiday; a best month is usually the one where you started. Each is worth remembering, with its date, and none is a target.
Two things about records are easy to misread. First, the day after a record is almost always ordinary; that is regression to the mean, not a lapse. Second, which records make sense depends on the period you are looking at. A single day has a best hour and a count of active hours; a week has a best day and a best hour; a year has a best day, week, month and hour. Walk Flower shows only the ones that fit the period on screen, so swiping back a month shows that month’s best day, not the all-time one.
Active hours and steps per hour
Hourly data is where a pedometer becomes interesting. A day of 8,000 steps walked in one lunchtime hour and a day of 8,000 steps spread across ten hours are the same on a daily chart and very different in how you spent the day.
An active hour is an hour with at least 250 steps. The 250 bar comes from Fitbit, which has nudged wearers to walk 250 steps an hour for a decade, and it is a sensible one: about two or three minutes of walking, enough to break up sitting. Counting active hours per day gives you a number that improves when you take the stairs or walk to a meeting, even on days your total doesn’t move. A best hour is the opposite: the single busiest hour of the period, usually a walk you’d remember.
If your daily total is fine but your active hours are low, you walk in one block and sit the rest of the day. Adding one short walk in the longest still stretch does more for how you feel than adding steps to the existing walk.
Your hourly rhythm
Lay 90 days of hours on top of each other and a shape appears: your walking rhythm, the average steps you take in each hour of the day. Most people have two or three peaks, a commute, lunch and an evening walk, and a long flat stretch in the afternoon. A weekday-by-hour heatmap does the same thing for the week: a grid of seven rows and 24 columns, with the darkest cells where you walk most.
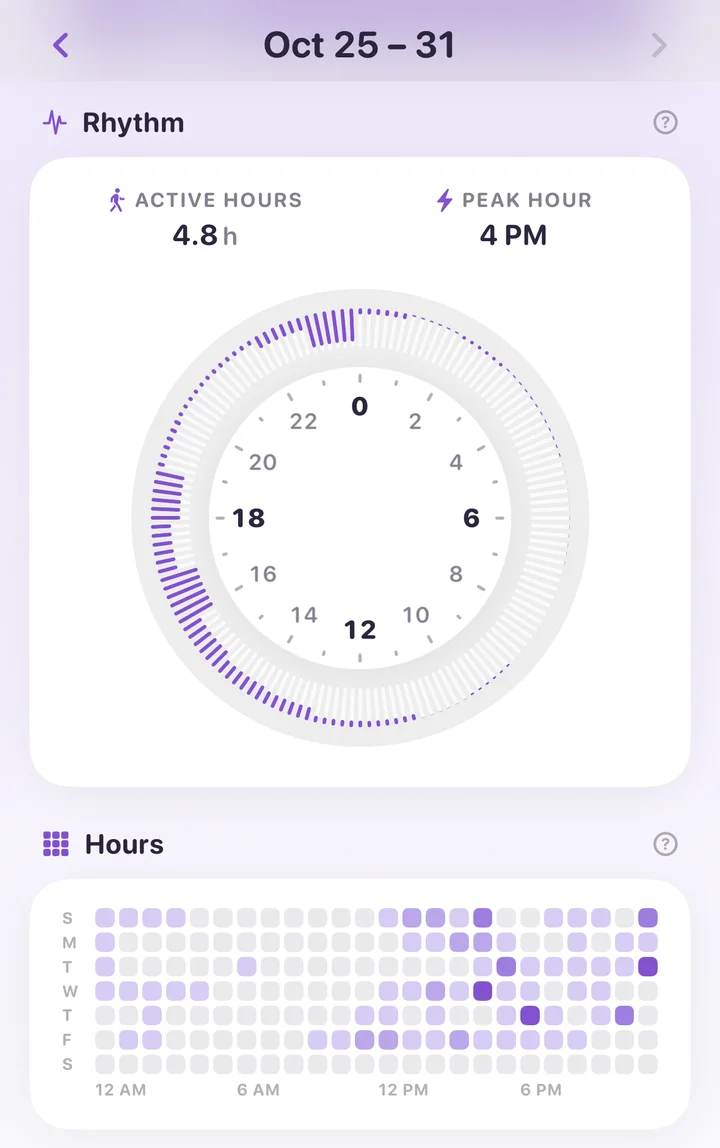
The rhythm is not something to optimise; it is something to read. It tells you when a new walk would fit (the empty cells), which weekday is the weak one, and whether your weekends are later and longer than your weekdays. Walk Flower draws it as a clock: a tick for every ten minutes of the day, with a bar growing inward for the usual steps in that hour. Hold a finger on the clock and the hour under it reads out its number.
The 28-day trend
A trend compares a recent window with the one before it. Four weeks is a good window: it covers every weekday four times, so a single lazy Sunday can’t swing it, and it is short enough to react to a change in routine within a month. Walk Flower shows the 28-day average to the end of the period you’re looking at, the change against the 28 days before, and the twelve weeks leading up to it as a row of pills.
Read the trend for direction, not size. Down 4% after a record month is noise. Down 20% for two months running is a change worth naming, and it usually has a cause you already know about.
Distance and floors, as journeys
Steps convert into distance through your step length, and an iPhone or Apple Watch records flights climbed from its barometer. Neither needs a target. They are more fun as a running total: the Golden Gate Bridge is 2.7 km, a marathon 42.2 km, the Camino de Santiago about 800 km, and the length of Japan about 3,000 km. At a floor of roughly 3 metres, 110 floors is the Eiffel Tower and about 2,950 floors is Everest. Walk Flower keeps both ladders and shows the next landmark you haven’t reached.
Walking speed, step length, steadiness and asymmetry
Since iOS 14 an iPhone measures how you walk, not only how much. The Health app files these under Mobility. They are estimated from the phone’s motion sensors while it is in a pocket or on a belt near your waist, and only from steady walking on flat ground, so a phone carried in a bag or hand produces no reading. Apple describes the method in its white paper Measuring Walking Quality Through iPhone Mobility Metrics.
- Walking speed is how fast you walk on flat ground, averaged over the day. Most adults land somewhere around 4 to 5 km/h (2.5 to 3 mph). It is the gait measure most studied in relation to general health, and a slow decline over years is more telling than any single day.
- Step length is the distance from one foot landing to the other. It depends on your height and leg length, so comparing it with a friend is meaningless. Comparing it with yourself is useful: it shortens when you’re tired, injured or cautious.
- Walking asymmetry is the share of your walking where one leg moves differently from the other, in other words a limp. 0% is perfectly even. A few percent is normal; a jump after an injury or surgery is expected and should settle as you recover.
- Double support time is the share of each stride with both feet on the ground. Lower is better, because it means more of your walking is spent balanced on one foot. The Health app’s own description puts a typical range at roughly 20 to 40%.
- Walking steadiness is Apple’s single score built from the four above. It is reported as OK, Low or Very Low, and Apple can notify you (and someone you choose) when it is low enough to suggest a raised fall risk in the coming year. It needs an iPhone 8 or later and a few days of walking with the phone near your waist; Apple explains the setup in Monitor your walking steadiness in Health on iPhone.
Two cautions. These are estimates, not clinical measurements: a 2023 validation study found the iPhone’s walking speed and step length matched lab equipment well, but it underestimated double support time and walking asymmetry. And the values only mean something against your own history. Healthy adults vary widely; what matters is a sustained change, which is worth mentioning to a doctor, not a number that differs from someone else’s.
Walk Flower shows these four as 30-day averages on the Profile tab, with the unit chip on speed and step length switching between metric, imperial and a couple of sillier units. They need Apple Health’s mobility permissions, which the app asks for only when you tap one of those cards.
Where these live in Walk Flower
Everything above is on the Profile tab, with a picker for Today, Week, Month, Year and All time, and a page for every period: swipe back and every card shows that week or month as it stood. Days, records, goal days, streak and the trend are free. The goal map, the rhythm clock, the hours heatmap, the distance and height journeys and the four walking-quality cards come with Walk Flower Premium.
All of it is computed on your phone from your own step history. None of your statistics are uploaded or stored on a server, and Health access is read-only.
Between the numbers, Walk Flower is still the same step counter: reach your season’s daily goal and today’s flower is ready to open. The statistics explain the habit. The flower is why you keep it.